
What Does a Filter Do to Your Water?
A water filter is a block of carbon, a membrane or a distillation tank placed between the tap and the glass. Researchers have measured the substances these devices remove from water, and sometimes the ones they add to it
Published · Updated
It all started with talks about water. The speakers explained that tap water has lost the order of its molecules, and that a device, the “revitalizer,” gives it back. The people selling it, for the price of a good computer, had the air of gurus, and the audience listened to them the way one listens to a sermon.
I looked for studies on this realigned water and found only pseudoscientific texts. But along the way, I learned that many cities publish the analyses of their tap water, and that it changes from one city to the next. Since I wanted to drink the cleanest water possible, I started reading about filters.
At that point I could not have said what a carbon filter is for, or how it differs from reverse osmosis. I was also told that the big filter jugs leave the water to go stale in their tank. And I had a vaguer fear, of the drug residues that end up in tap water. About the filters themselves, I heard two things that contradicted each other: that they make water purer, or that they strip it of its minerals to the point of making it “dead.” I understood fairly quickly that the word covers three devices, the carbon block, the reverse osmosis membrane and the distiller, and that they do not remove the same substances (J. Wu et al. 2021; Yu et al. 2024).
The cartridge
The most common is the cartridge you screw onto the tap, a small casing filled most often with carbon, sometimes mixed with other materials (J. Wu et al. 2021). Water passes through it under the network’s pressure alone and leaves behind part of the substances it carries.
Filter jugs gave me more trouble than the rest. In 2025, a team of dental health researchers ran tap water through nine jugs sold in shops. They measured the minerals coming out of each jug, liter after liter, to see the effect of the filter’s aging (Hazzazi et al. 2025). Seven jugs out of nine lowered calcium, three lowered magnesium and two lowered fluoride, while sodium rose in one and fell in another. According to the authors, these differences would come from the materials each brand puts in its cartridge, but they could not check this (Hazzazi et al. 2025).
I could hardly understand how carbon could hold back calcium, until the day I read that many jugs also contain a resin. It captures calcium and magnesium and releases other ions in their place, so much so that one manufacturer itself presents its cartridge as “partially demineralizing” (Brita GmbH 2024; Hazzazi et al. 2025).
The carbon
The activated carbon that fills these cartridges and jugs is carbon pierced with countless tiny pores. In these pores, the molecules dissolved in the water stick to the walls, some very well and others barely (Rivera-Utrilla et al. 2011; J. Wu et al. 2021). Since nothing visible from the outside shows which ones a device holds back, the safest course is to look at its certifications (C.-C. Wu et al. 2021).
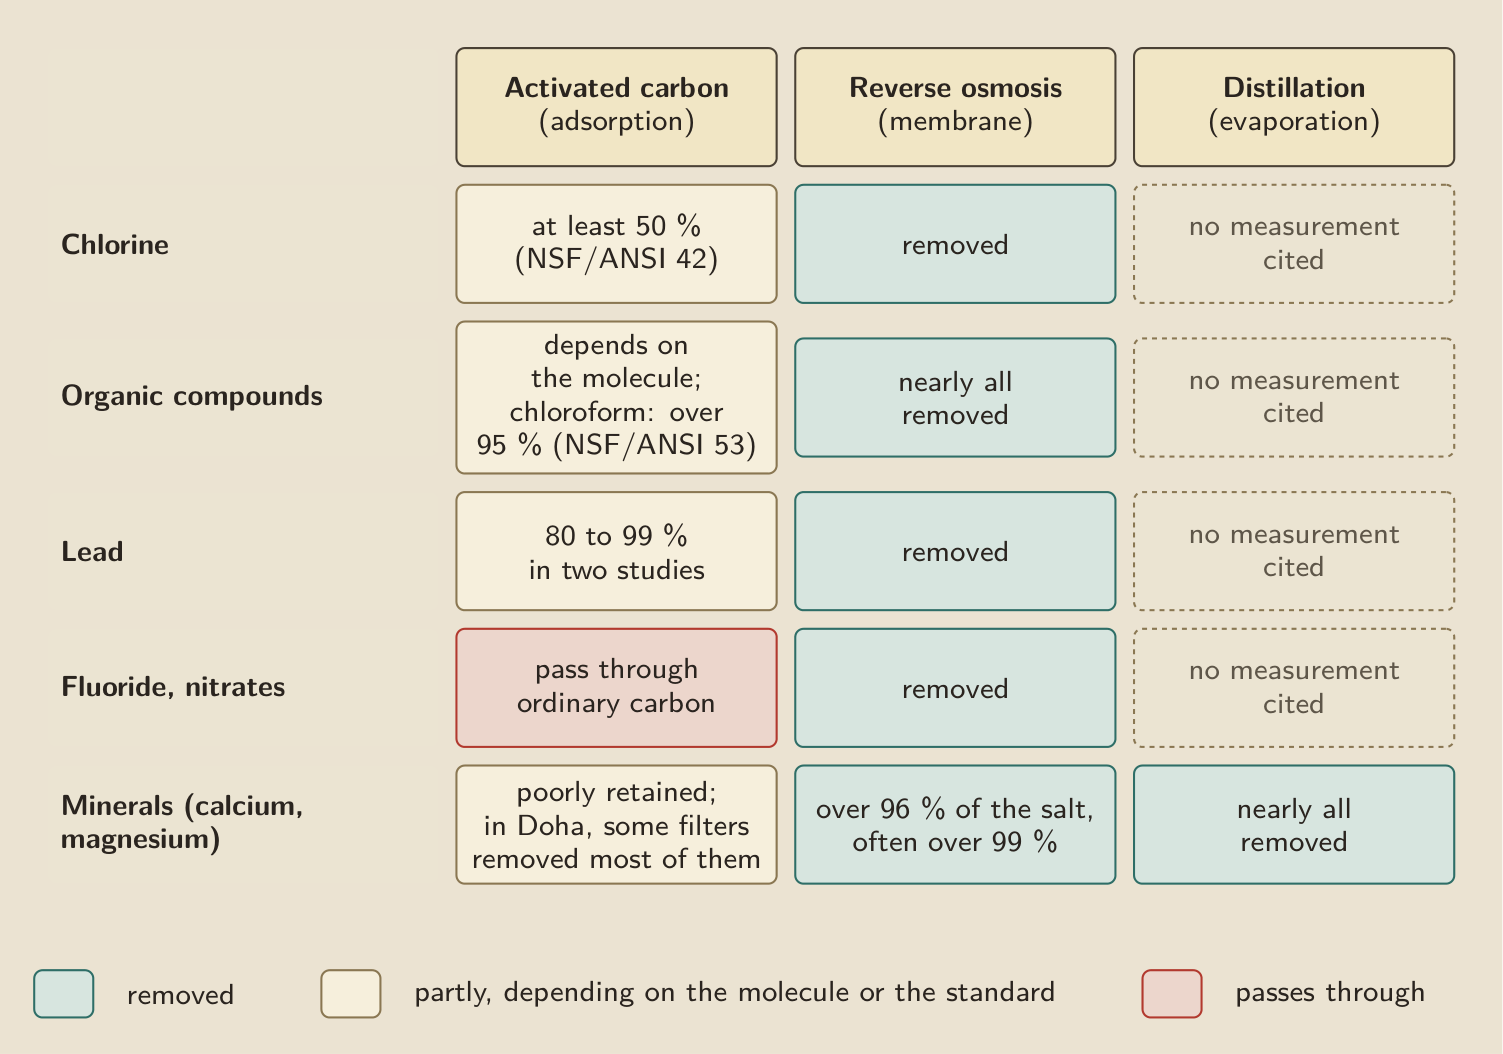
In North America, these certifications follow the test standards of the organization NSF International (NSF International 2025). Standard 42 covers chlorine, taste and odor: to obtain it, a device must remove at least half of the chlorine from water containing 2 milligrams per liter (Santé Canada 2009). Standard 53 covers contaminants that affect health, and it requires, for example, removing more than 95% of chloroform, a by-product of chlorine (Health Canada 2025). Lead has its own certification, which the packaging mentions (NSF International 2026), and in two studies listed in 2017 by a review of household filters in the United States, carbon blocks held back 80 to 99% of it (Brown et al. 2017).
These rates also depend on how long the water spends in the carbon (J. Wu et al. 2021). A team saw this in granular carbon filters, where water that passes through too fast leaves part of the carbon unused. Their study, however, dealt with wastewater, and I read only its abstract (Fundneider et al. 2021).
Drug residues were my first worry, and I learned that a separate standard, NSF/ANSI 401, targets these substances present in trace amounts (J. Wu et al. 2021; NSF International 2025). For sixteen of them, the same review reports a test in which two refrigerator carbon blocks and a jug held back from 70 to more than 90% at first (Brown et al. 2017). That only half reassured me, because I still do not know the effect on the body of the share that gets through.
PFAS, fluorinated compounds of industrial origin found in some tap water, worried me more. In 2020, researchers sampled the water of 73 homes in North Carolina, before and after their filter (Herkert et al. 2020). In these homes, carbon removed on average 60 to 70% of long-chain PFAS and about 40% of short-chain ones, which reassured me at first. But in four of the eight carbon systems that treated the whole house, the water came out more loaded than it went in. According to the authors, saturated carbon was releasing the PFAS it had accumulated (Herkert et al. 2020). I had never imagined that a filter could make water worse than before, and that figure stopped me for a while.
Dissolved fluoride, for its part, passes through ordinary carbon. To hold it back, researchers modify the carbon by impregnating it with other substances or fixing it onto other materials (Habuda-Stanić et al. 2014). Nitrates call for other processes again, which other researchers reviewed in 2022: reverse osmosis, ion exchange resins and treatments that turn them into nitrogen gas (Abascal et al. 2022).
That left the question of minerals, which carbon holds back poorly since calcium and magnesium are dissolved salts (Rivera-Utrilla et al. 2011). In Doha, Qatar, the label of the best-selling carbon filters even said that they do not remove dissolved mineral compounds. Yet when a team measured the water in homes in the city, the filters fitted where the water enters the house and those in the kitchen, made of carbon or of polypropylene fibers, a plastic, had removed most of the minerals added to the water after its desalination. They attribute this to ion exchange at the surface of the filters (Nriagu et al. 2018).
The membrane and the tank
Reverse osmosis and distillation go much further, since they remove almost all minerals (J. Wu et al. 2021; World Health Organization 2009). Reverse osmosis pushes water under pressure through a membrane so fine that the salts stay on the other side. Of the dozens of these membranes listed in a 2019 review, most hold back more than 96% of the salt, often more than 99% (Yang et al. 2019). The distiller, for its part, boils the water and collects the steam, leaving the salts in the tank. Since the water comes out almost empty of minerals, a cartridge that gives it back some calcium or magnesium is often fitted after the membrane (Putri et al. 2025; Vingerhoeds et al. 2016).
In 2014, two researchers measured this reverse osmosis water in two military garrisons, where private vendors produced it from water with a normal mineral content. It contained 50 to 180 milligrams of dissolved salts per liter, 124 on average, whereas ordinary water holds 500 to 2,000 according to them. It no longer had any chlorine to protect it in the plastic cans it traveled in, and the two authors, who also found it flat and tasteless, argued for chlorinating it again (Verma and Kushwaha 2014).
 Tap to enlarge
“Dead” water
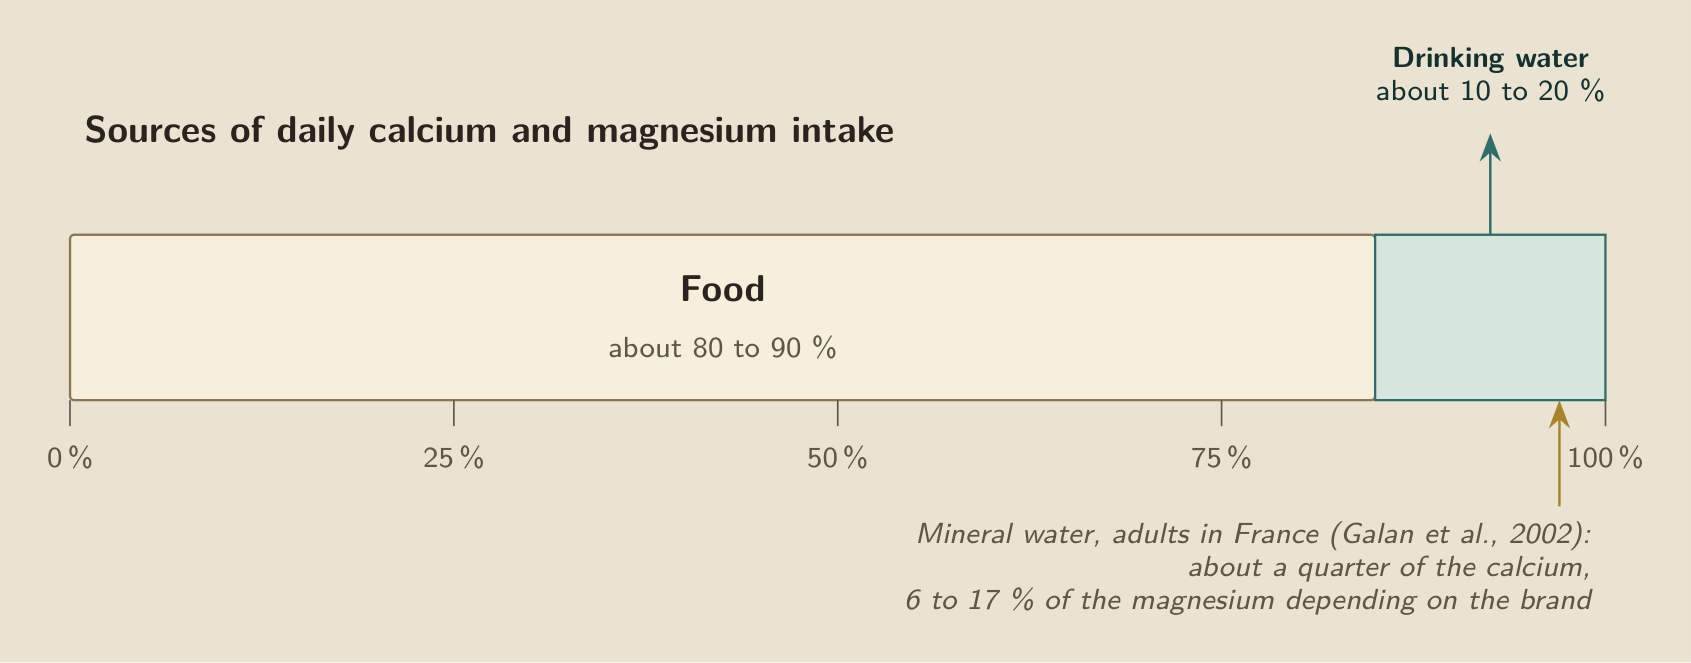
Around me, this almost empty water was frightening, and I looked for how much calcium and magnesium water provides in a day. Almost all of it in fact comes from the plate (World Health Organization 2009; Vannucci et al. 2018; Cormick et al. 2020): among those who consume them, milk and cheese alone provide more than half of the calcium (World Health Organization 2009).
A World Health Organization book put the share from water at between 10 and 20% in 2005 (Ong 2005). It falls to a few percent with water low in minerals, and it rises with hard water or a rich mineral water. Among adults studied in France in 2002, mineral water thus provided about a quarter of calcium and 6 to 17% of magnesium, depending on the brand chosen (Galan et al. 2002).
 Tap to enlarge
The body absorbs this calcium well. In 2000, three researchers brought together the studies that compared the calcium in a mineral water with that in dairy products, and the water even did slightly better (Böhmer et al. 2000). Magnesium is no different: in 2002, a team had men drink a mineral water and measured that they absorbed its magnesium well (Verhas et al. 2002; World Health Organization 2009). But the intake varies a great deal from one water to another, as measurements taken on water networks in South America show (Cormick et al. 2020).
I drew a line of reasoning from this, which is only mine. For an adult who eats a varied diet, water without minerals does not by itself create a deficiency (Cashman 2002; Vannucci et al. 2018; World Health Organization 2009). For those who eat few dairy products, the share from water weighs more, even though none of these studies measured this case directly (Galan et al. 2002; Vannucci et al. 2018; Cormick et al. 2020). This reasoning assumes an adequate diet, and it leaves aside the growing child and poor diets.
In that same WHO book, devoted to the minerals in drinking water, Frantisek Kozisek wrote the chapter on demineralized water (Kozisek 2005). In it, he proposes minimum levels for water that has lost its minerals: about 10 milligrams of magnesium per liter, and about 20 of calcium. The ideal, in his view, would be 20 to 30 milligrams of magnesium and 40 to 80 of calcium. These figures are an expert’s proposals, drawn from the work he brought together, and no law imposes them (Kozisek 2005; World Health Organization 2009).
Since the calcium in water is well absorbed, I had deduced that cooking water counts too, and not only the water we drink (Cashman 2002; Vannucci et al. 2018). Kozisek’s figures surprised me by their size: according to him, vegetables cooked in demineralized water lose up to about 60% of their calcium and magnesium, 66% of their copper, 70% of their manganese and 86% of their cobalt (Kozisek 2005). Before him, in 1990, two researchers had weighed the minerals in dishes from institutional kitchens, before and after cooking. These dishes kept on average only 60 to 70% of them, and vegetables lost the most. Hence their advice to eat boiled vegetables with their broth (KIMURA and ITOKAWA 1990).
The idea that hard water protects the heart comes from comparisons between regions. In 1957 in Japan, then in 1960 in the United States, researchers noticed that fewer people died of heart and blood vessel diseases where the water is rich in calcium and magnesium (Catling et al. 2008; World Health Organization 2009). But they were comparing entire regions, without knowing which water each inhabitant drank, and later research mostly suspected magnesium (World Health Organization 2009).
The subject remains the most debated of all (Bykowska-Derda et al. 2023). The work brought together by the WHO in 2009 associates water rich in magnesium, and less clearly in calcium, with fewer cardiovascular diseases, especially strokes (World Health Organization 2009). In 2022, a team followed 26,733 Swedish women for sixteen years. Those whose water was richest in magnesium had about a 30% lower risk of a stroke caused by a clot. For heart attacks, on the other hand, the difference was barely visible (Helte et al. 2022).
In 2023, other researchers reviewed twenty-five studies, seventeen of which found fewer cardiovascular deaths where the water is hard. They nevertheless call for more research, because these studies are very different from one another (Bykowska-Derda et al. 2023). Before them, in 2008, another team had reached the same result for magnesium, with a confused picture for calcium (Catling et al. 2008). In 2016, a third team brought together ten studies totaling 77,821 cases of coronary heart disease. In these studies, nine of which came from Europe, the risk drops by about 10%, with a margin of uncertainty that comes close to no effect at all (Jiang et al. 2016).
All these studies observe people who drink the water of their region, without anyone changing that water (Monarca et al. 2006; Catling et al. 2008). They note a link without being able to show that magnesium is its cause (Helte et al. 2022; Jiang et al. 2016; Bykowska-Derda et al. 2023).
Kozisek also cites weaker signals, which he gives as reasons to be cautious. These signals associate very soft water with more fractures in children, premature births and neurological disorders (Kozisek 2005). Finally, he notes that water without minerals tastes bland (Kozisek 2005; Verma and Kushwaha 2014).
The water before the filter
In Switzerland, for example, tap water is among the most closely controlled foods even before it reaches the filter (Office fédéral de la sécurité alimentaire et des affaires vétérinaires (OSAV) 2023). The suppliers analyze it, public laboratories check their work, and building owners are answerable for its quality in their pipes. On water of this quality, carbon mainly removes chlorine and bad tastes, such as geosmin, which gives water an earthy taste (Srinivasan and Sorial 2011; J. Wu et al. 2021; NSF International 2025).
Public control, however, stops at the meter, and beyond it the water runs through the building’s plumbing, where some germs settle for good (Falkinham et al. 2015; Office fédéral de la sécurité alimentaire et des affaires vétérinaires (OSAV) 2023). The composition of the water also matters in these pipes. Calcium and alkalinity, which measures the water’s resistance to acidity, help lay down a protective layer on the pipe wall, and when they are lacking, the water eats into the metal and carries away lead and copper, especially when it has stagnated (Kozisek 2005).
In Flint, Michigan, the water was not demineralized, but it became corrosive. In April 2014, the city took water from its river without corrosion treatment. Ten months later, the water in one home contained 104, then 397, then 707 micrograms of lead per liter (Pieper et al. 2017). In September 2015, blood tests showed that lead had increased among the city’s children (Hanna-Attisha et al. 2016; Pieper et al. 2017). For a home whose old pipes add lead or another contaminant, there are devices certified for that specific contaminant (NSF International 2025; Srinivasan and Sorial 2011; J. Wu et al. 2021).
The chlorine that carbon removes does have a role, though, since it remains in the water in small amounts to protect it from germs all the way to the tap. When it drops, the bacteria living in the pipes change (Rand et al. 2014; Bertelli et al. 2018). It has its limits, and a researcher showed in 1999 that at these doses it does a poor job of killing germs that enter the network by accident (Payment 1999).
The bacteria in the cartridge
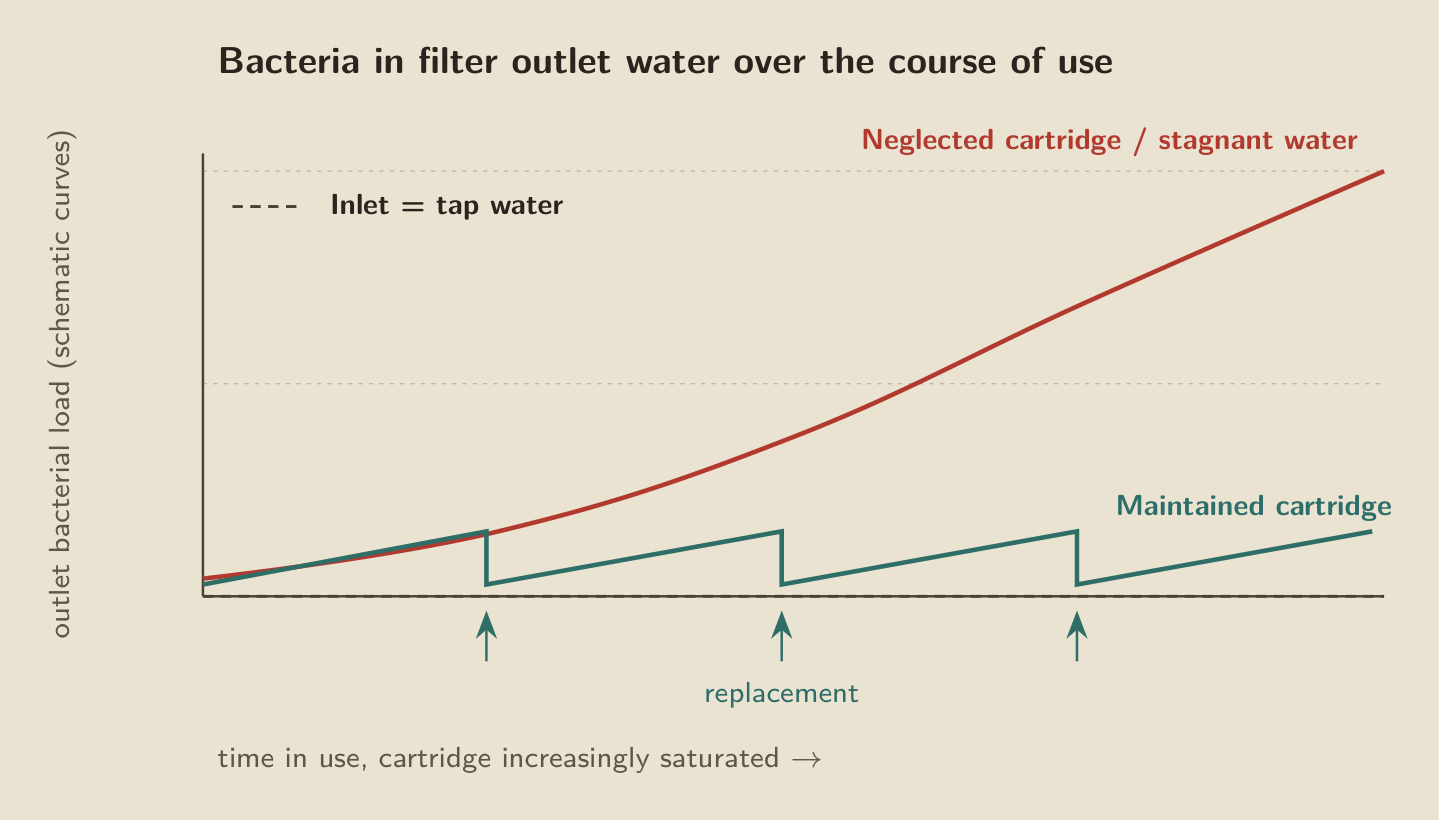
That left me the story of the jugs that go stale. But activated carbon is not made to stop bacteria, and the organic matter it accumulates feeds them. By removing chlorine, it also takes away the disinfectant that was slowing their growth (C.-C. Wu et al. 2021; Nriagu et al. 2018).
Three researchers point out in 2021 that several studies counted more bacteria at the outlet of these filters than at the inlet, even during the intended period of use (C.-C. Wu et al. 2021). To see how they settle in, they ran tap water through carbon blocks, in bursts over the course of the day, as in a kitchen. They had added two labeled bacteria to this water. One of them, Pseudomonas aeruginosa, a germ that makes vulnerable people ill, passed through the carbon faster than the other. It settled in the filter’s biofilm, a layer of bacteria caught in a kind of jelly that protects them (C.-C. Wu et al. 2021).
In Doha, the team that had measured the minerals had also counted the bacteria in the water as it arrived in the homes: about 4 per milliliter. At the tap, after the tanks and filters, there were 1,229 on average. The deposits trapped in these filters contained lead, which could go back into the water with every change in pressure. The authors conclude that the filters in these homes were degrading the water, even though they point out that their count says little about the presence of dangerous germs (Nriagu et al. 2018).
Water that stagnates between uses and a cartridge kept too long favor these bacteria (C.-C. Wu et al. 2021; Nriagu et al. 2018). A 2023 study looked at this stagnation in household carbon filters (Alfredo 2023). Another team showed in 2026 that a filter combining carbon and polypropylene stops particles while serving as an incubator for microbes (Li et al. 2026). To slow these bacteria, you can change the cartridge as the instructions say and let the water run after a long pause, but even a well-maintained cartridge can be colonized (Alfredo 2023; Li et al. 2026; Nriagu et al. 2018; C.-C. Wu et al. 2021).
I also wondered whether an aging plastic cartridge releases microplastics, but none of the sources I read looked for them at the outlet of a filter.
 Tap to enlarge
I did not look at brands or at water treatment in the plant, and on the revitalizer from the beginning, I found no study at all. My sources deal with the physics and biology of household filters, and with the opinions of public health bodies.
For my part, “dead” water no longer frightens me, because for someone who eats a varied diet, the minerals in water weigh little. But cartridges worry me more: I did not expect to find so many bacteria in a maintained cartridge, nor that so many jugs also remove calcium, through a resin housed next to the carbon. In the tests I read, a certified carbon device keeps the promise of its standard for chlorine and lead, as long as its carbon is not saturated. As for the link between magnesium in water and the heart, it remains an observation.
References
What has changed
- : The text is rewritten as the story of an inquiry, with no lesson drawn along the way and no pointers to other articles, and each source is given in parentheses. Its title does not change. The three diagrams are redrawn. What prompted it: The diagrams now show only values read in the article's sources: the table of processes loses a row on bacteria and two values for reverse osmosis that no source supported, and it says when no measurement is cited for distillation. All of the article's sources are retained. The share of drinking water in calcium and magnesium intake now rests on a chapter of a 2005 World Health Organization book, which puts it at between 10 and 20%, instead of a range of 5 to 20% attributed to a 2009 report that does not contain it, and the share of milk and cheese in calcium now follows its source: more than half.
- : The text is rewritten from the author's own account of what led him to water filters and the questions he was asking. What prompted it: The article now starts from the experience that gave rise to it. No source changes, and every sentence remains linked to the source it cites.
- : The absorption of calcium from mineral waters now rests on its direct source. What prompted it: The claim made a comparison with dairy products without the meta-analysis that measures it.10.1007/s001980070032
- : The cardiovascular passage gives the pooled estimate for coronary mortality, more modest than the Swedish figure, which concerned another outcome. What prompted it: A meta-analysis of ten studies and 77,821 cases, brought up by the re-examination, places the relative risk at 0.89 with an upper bound of 0.99, high heterogeneity and nine of ten studies from Europe. The text led with a hazard ratio of 0.69 that concerned the incidence of ischaemic stroke.10.3390/nu8010005
- : The cardiovascular passage refers to the paper that examines why an association does not establish a cause. What prompted it: This text invokes that rule four times as self-evident, whereas another paper in the corpus devotes its apparatus to it. The reader had no way to know.
- : The method used is identified as the same as in the paper on waste sorting. What prompted it: The two texts construct the same tool around a household act, without anything saying so.
- : A 2023 meta-analysis on water hardness and cardiovascular mortality is added, together with the heterogeneity it reports. What prompted it: It combines twenty-five studies and concludes that there is a lowering effect, while reporting high heterogeneity that the text did not mention.10.3390/foods12173255