
Does sorting your waste do any good?
Sorting your waste means separating glass, paper, aluminium or plastic at home so that each goes to its own recycling stream. Researchers and statistical offices have followed these materials after the bin: the share that becomes a raw material again, the energy it saves and the losses along the way
Published · Updated
For a long time I believed that sorting waste did not achieve much. I told myself that manufacturers themselves do not sort, and that household bags end up in large incinerators anyway, for lack of any way to make use of them. Yet I often heard the opposite view, from people who carefully separated cardboard, aluminium and plastic bottles. One day I wanted to know who was right, and I followed the waste after the bag was tied.
The answer soon depended on the material, because an aluminium can does not have the balance sheet of a soft plastic film, and a stream that works in one country is sometimes missing in the next. So I took six materials from household bins one by one: aluminium, glass, paper and cardboard, the PET of bottles, mixed plastics and metals. For the country, I chose one where my suspicion held to the letter. In Switzerland, since 1 January 2000, combustible waste may no longer go to landfill, and rubbish that is not sorted goes to incineration (Office federal de l’environnement (OFEV), Suisse 2000).
Once the bag is tied
The Federal Council had set this ban in 1996, by amending the ordinance on waste treatment. On 29 January 1999, the director of the federal office for the environment announced that municipal waste and other non-recyclable combustibles could be incinerated, and he acknowledged that the transition would raise difficulties (Office federal de l’environnement (OFEV), Suisse 2000). In this system, sorting happens at home, before the plant, whereas in Germany the dual system leaves more room for sorting done after collection. If you throw a bottle in with mixed rubbish, it never again reaches the glass collection (Manfredi and Goralczyk 2013; Office federal de l’environnement (OFEV), Suisse 2023; Picuno et al. 2021).
The Federal Office for the Environment divides the country’s municipal waste into two roughly equal halves, one recycled or composted, the other incinerated (Office federal de l’environnement (OFEV), Suisse 2023). I looked for how much material comes out of each stream, and its figures do not say, because they stop at the entrance.
Incineration plants recover heat for district heating and electricity for the grid, but the material that is burned is lost (Turconi et al. 2011). In 2011, a team compared Danish and Italian plants using two methods of life cycle assessment, a calculation that follows a product from its manufacture to its disposal. Their balance credits the plants with the heat and electricity they supply. But the aluminium and other metals lost in the furnace have to be produced again elsewhere, whereas for some plastics that are hard to recycle, the gap with recycling narrows (Turconi et al. 2011).
In Eurostat’s statistics for 2023, Switzerland is among the European countries that produce the most municipal waste per inhabitant, with a high recycling rate. Waste from building sites and from industry stays outside this count (Eurostat 2023).
Two ways of counting
The word “recycling” played a trick on me as soon as I wanted figures, because it covers two counts. The collection rate measures the material that enters a stream, before any treatment. The real recycling rate keeps only the material that is reused, once rejects and losses have been removed (OECD 2022).
For plastic, the gap between the two is huge. In 2017, three researchers drew up a global account of all the plastic ever produced and what became of it (Geyer et al. 2017). The OECD took up the question in 2022, separating the quantities collected from real recycling, which it counts after removing contaminants and plastics with no outlet, among other things. In its global account, about four tenths of the plastic collected for recycling is lost during treatment, so that out of a hundred kilos picked up, around sixty remain (OECD 2022).
Calculation rules also move the figures. Since European decision 2019/1004, recycling is measured at the input to the final recycling operation, and some treatment losses that certain rates used to count are now excluded. On paper, an official rate can thus fall without the stream having changed (Union europeenne 2019).
Part of Europe’s plastic waste also leaves the continent. The OECD tracks this waste as countries declare it, and the import and export accounts do not always match (“Monitoring Trade in Plastic Waste and Scrap” 2024). In countries that lack treatment facilities, waste has ended up scattered in the environment or burned in the open (“Plastic Leakage from Mismanaged and Littered Waste” 2022). In 2019, the Basel Convention, which governs movements of waste between countries, tightened its rules for plastic (Convention de Bale 2019).
The can
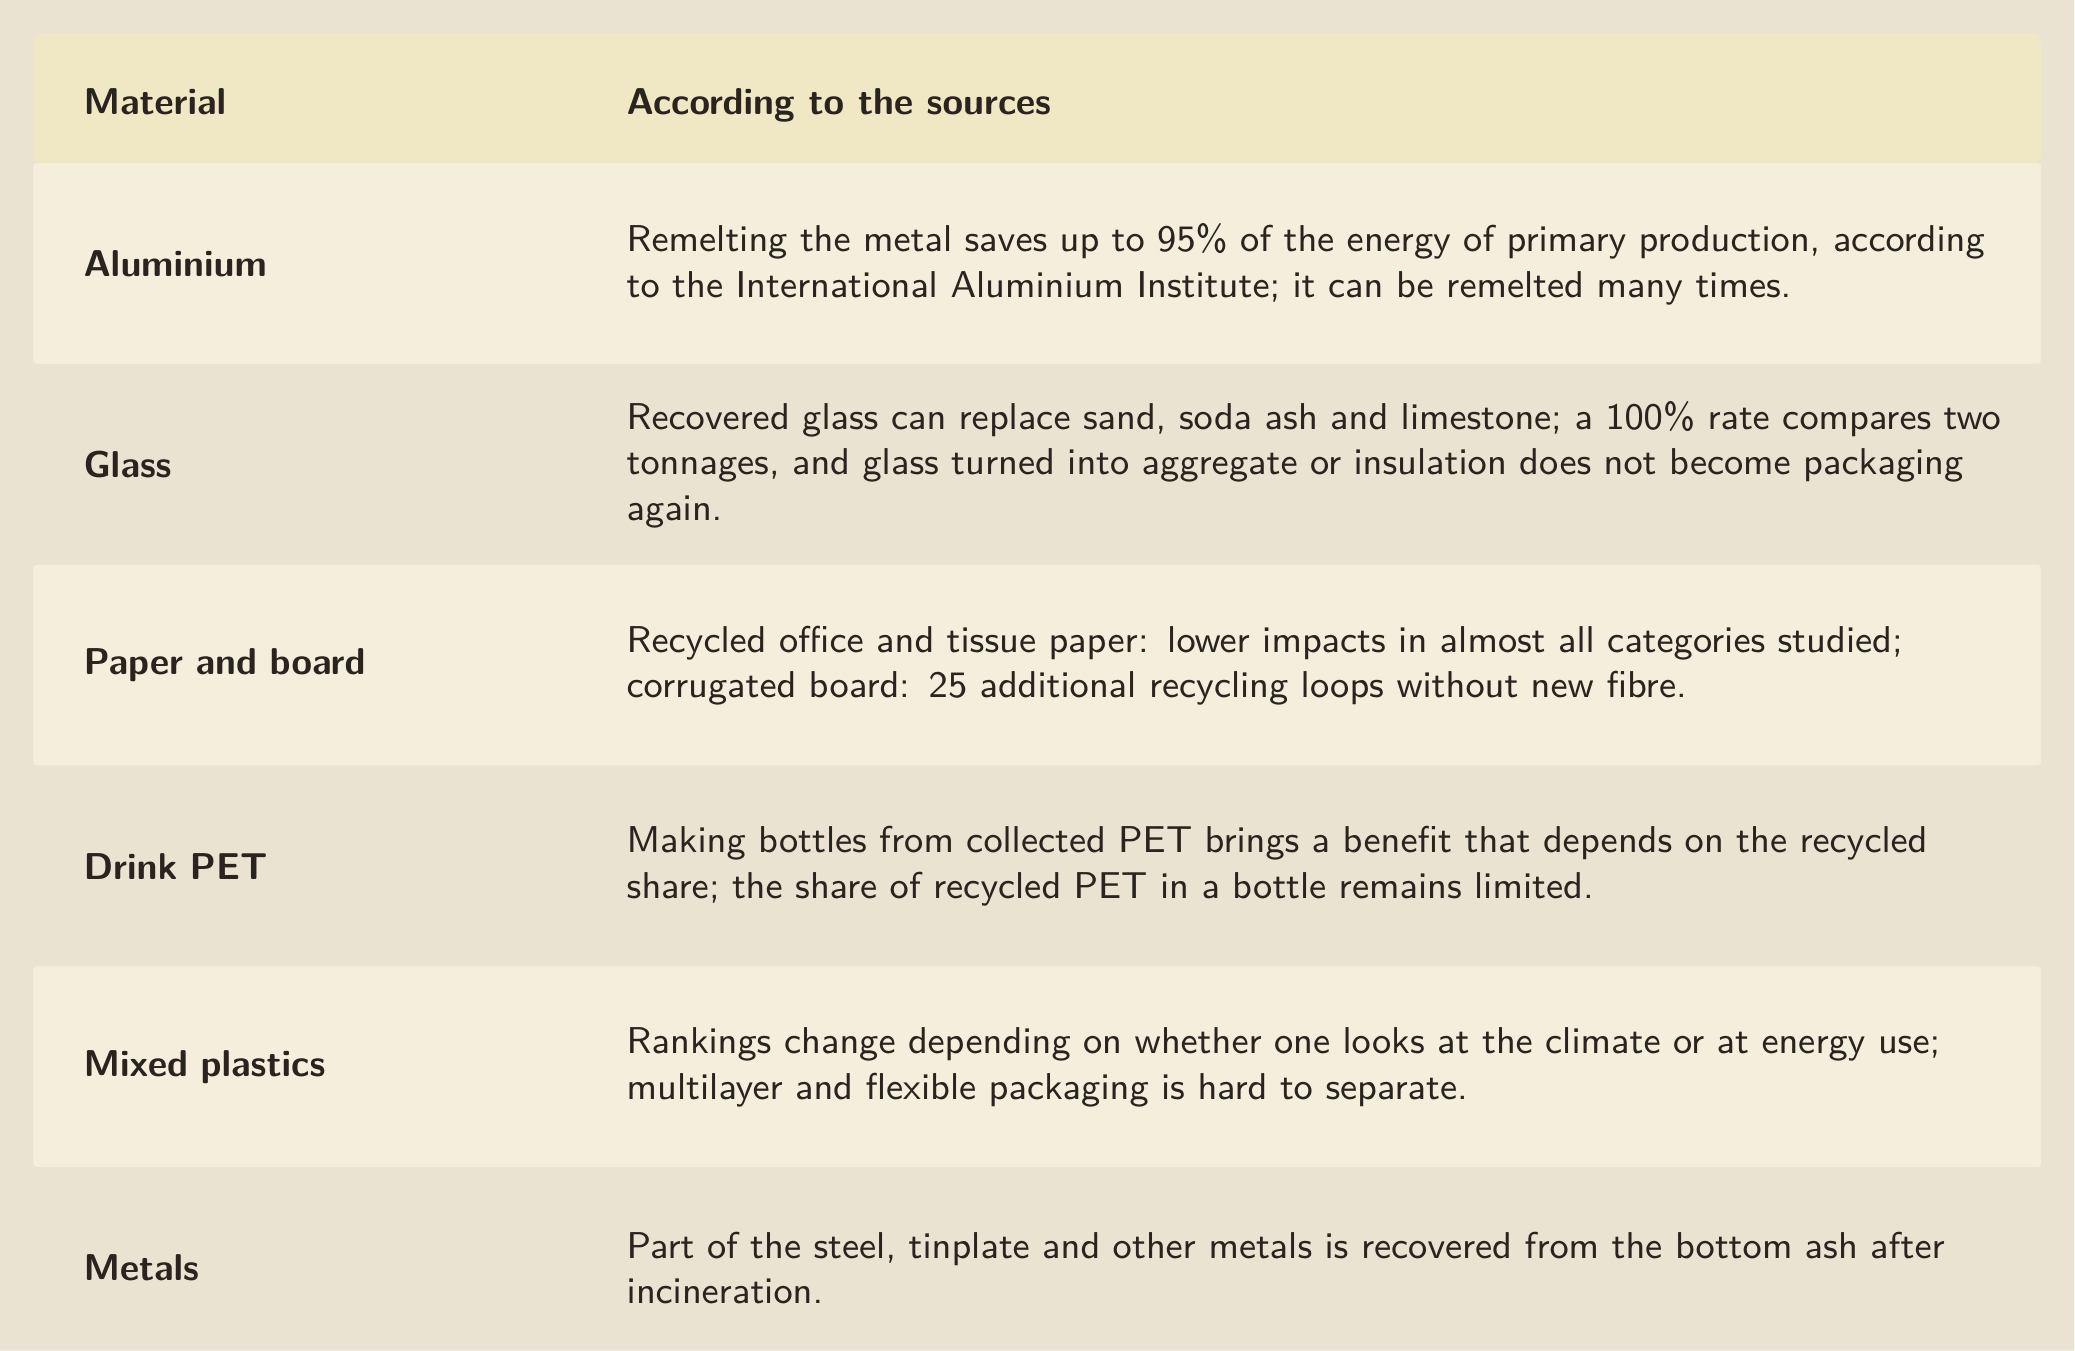
Aluminium surprised me by the size of the gain. Extracting it from bauxite, its ore, takes an enormous amount of electricity, above all for electrolysis, the step in which an electric current frees the metal from its oxide (International Aluminium Institute, n.d.; Wikipédia s. d.). The International Aluminium Institute, which represents the industry, states that up to 95% of the energy is saved when the metal is remelted instead of being extracted from ore. And the metal can be remelted a great many times without losing its properties, so the saving comes back with every round (Olivieri et al. 2006; International Aluminium Institute, n.d.).
In Switzerland, the industry’s cooperative reports a high recycling rate for aluminium cans and packaging, without every item of packaging being reached (IGORA / Cooperative pour le recyclage de l’aluminium, Suisse 2023).
Glass, two tonnages
For glass, the industry highlights the raw materials saved: recovered glass replaces the sand, soda ash and limestone that would otherwise have to be melted to make new containers (Glass Packaging Institute 2010). These arguments come from the Glass Packaging Institute, the organisation of North American manufacturers. Its own scenario also counts transport, contaminants and sorting, and it concludes that the CO2 avoided by recycling equals or exceeds that of transport (Vellini and Savioli 2009; Glass Packaging Institute 2010).
In Switzerland, the body that manages used glass reports a recycling rate of 100% for 2023, and at first I thought it was a mistake (VetroSwiss / OFEV 2024). This rate compares two tonnages, the glass recycled and the beverage packaging sold, and that year the first slightly exceeds the second. It varies by one or two points from one year to the next, and it does not say that every bottle has become a bottle again. A bottle turned into aggregate or insulation never becomes packaging again (VetroSwiss / OFEV 2024; Glass Packaging Institute 2010).
Twenty-five more recyclings
I had always heard that a paper fibre can only stand four to seven recyclings. In 2022, the German Environment Agency had office papers and recycled tissue papers compared with their virgin-fibre equivalents, and the recycled papers had less impact in almost every category studied. The same report cites a mix of corrugated board recycled twenty-five more times without any input of virgin fibre, and its authors consider the old rule refuted. Some types of board, however, remain outside their comparison (Wellenreuther et al. 2022).
Virgin fibre keeps its place: in 2018, German production still used 5.5 million tonnes of it, alongside about 14.5 million tonnes of recycled fibre (Wellenreuther et al. 2022). Collection of paper and cardboard is high, in Switzerland as elsewhere in Europe, but here again the figures stop at the material collected (Merrild et al. 2008; Office federal de l’environnement (OFEV), Suisse 2023).
Metals in the ashes
Metals keep a second chance after the furnace. When rubbish is burned, bottom ash remains, the solid residue of combustion, and in 2020 researchers reviewed the ways of recovering metals from it (Šyc et al. 2020). Steel and tinplate are separated from it with a magnet before going back to recycling. Eddy current separators, rotating magnets that repel non-magnetic metals such as aluminium, extract another part. These two sorting steps recover only a share, and a metal thrown into the wrong bin is thus partly caught again (Šyc et al. 2020).
The bottle and the film
It was on plastic that my old doubt found the most support, and yet the PET of beverage bottles turned out to be a case apart.
In 2023, two researchers found a benefit in making bottles again from collected PET. This gain depends on the share of recycled material in each bottle and on the way impacts are allocated between products (Chairat and Gheewala 2023). I could only read the abstract of their study. In Switzerland, the industry body states that about eight beverage bottles out of ten are recycled, thanks to a collection network reserved for them. The figure, published by the industry, is calculated by the Federal Office for the Environment, and it covers only these bottles (PET-Recycling Schweiz 2023).
Recycled PET also has its limits. In 2021, two other researchers described the health requirements it must meet, its yellowing and the degradation of its long molecules with every pass. The share of recycled material that can be put back into a bottle therefore remains limited, and new plastic sometimes has to be added (Damayanti and Wu 2021).
At the scale of the world, the figure drops. The three researchers behind the global account, then the OECD, put the real recycling of plastic waste at around 9%, the rest being incinerated, landfilled or scattered in the environment (Geyer et al. 2017; OECD 2022). This global average mixes very different systems. For 2019, the OECD counts 353 million tonnes of plastic waste, of which 55 million were collected for recycling and 22 million were residues to be disposed of after sorting (OECD 2022).
For mixed plastics, a team compared three routes in 2021 (Jeswani et al. 2021). Mechanical recycling grinds and remelts the material, pyrolysis heats it without oxygen to draw a kind of oil from it, and energy recovery burns it in an incinerator. Their ranking changes with the indicator. In their scenario that counts both the product and the waste, mechanical recycling weighs less on the climate than energy recovery, while the two consume fairly similar amounts of energy (Jeswani et al. 2021).
Multilayer, composite or flexible packaging raises another problem. Other researchers listed the difficulties it poses for mechanical recycling, starting with the separation of materials stuck together in a single package (Kaiser et al. 2017). The authors of the global account, for their part, describe recycled materials of low value, both technical and commercial, as soon as plastics are mixed or soiled (Geyer et al. 2017).
I had often heard it said that plastic recycling is a lie. In the studies I read, I found technical limits and a great many losses, but no trace of an intention to deceive. As early as 2011, researchers studying microplastics pointed out that part of plastic is recycled and that the largest share ends up in landfill. Large debris, as it breaks down, gives microplastics, tiny fragments found on land as well as at sea (Cole et al. 2011).
The price of fire
Burning a plastic made from oil emits carbon dioxide of fossil origin, and the heat recovered does not erase these emissions (Turconi et al. 2011). In a country where landfill remains the only other route, the calculation can credit incineration with the methane the landfill would have released (Turconi et al. 2011). This credit falls away in Switzerland, where combustible waste has not gone to landfill since 2000 (Office federal de l’environnement (OFEV), Suisse 2000).
The balance of the same waste also changes with the electricity grid, transport distances and the outlets for the recycled material. The team that compared the Danish and Italian plants thus notes serious analyses that reach opposite conclusions from one country to another (Turconi et al. 2011). I had hoped for a simple verdict, and at first this answer annoyed me.
One hundred companies
Another figure has often been put to me: one hundred companies are said to emit 71% of greenhouse gases, and an individual’s gesture would weigh nothing beside them. I went back to its source, the Carbon Majors Report, published in 2017 by CDP, an organisation that records companies’ emissions (Griffin 2017). The Carbon Majors Report covers one hundred producers of oil, gas and coal. Over the period from 1988 to 2015, the emissions linked to their fuels represent 71% of global industrial emissions, counting those of the consumers who burn these fuels (Griffin 2017). The count therefore runs from extraction to use, and it does not point to one hundred brands set apart from the rest of the economy.
Producers nonetheless have their share elsewhere. The OECD describes how the design of a plastic product and the choice of its substances set its impacts over its whole life (OECD 2022). It also describes extended producer responsibility, which makes whoever puts the product on the market pay for managing its waste, and which can increase recycling (OECD 2022).
After the first gesture
I still had one fear: that a sorting gesture would serve as a clear conscience and then license everything else. In 2014, a team reviewed the studies on the effect of a first green gesture on the ones that follow. A first effort can be followed by a slackening, which psychologists call moral licensing, or on the contrary lead to others, and neither happens for certain (Truelove et al. 2014).
In 2025, researchers gathered one hundred and fifteen experiments on this moral licensing. They corrected for publication bias, the tendency of journals to publish more readily the studies that find an effect, and they find moral licensing only in people who know they are being observed, and no effect in the others (Rotella et al. 2025). As early as 2019, two psychologists had reworked the data of two meta-analyses, studies that pool the results of many others, and found an effect inflated by this same bias (Kuper and Bott 2019). In 2024, a team repeated the experiment that had launched the idea, with a protocol registered in advance, and did not find its result again (Xiao et al. 2024). My fear came out of it somewhat deflated.
The rebound effect follows another logic: when a use becomes cheaper, people use it more, and part of the efficiency gain disappears. The team that had studied the effect of a first gesture distinguishes this rebound from moral licensing and discusses positive, negative and null effects, without setting a share of the gains that would be lost everywhere (Truelove et al. 2014).
The opposite excess exists too: putting a non-recyclable object in the bin, in case it might be recyclable. This false sorting soils the material stream and can degrade recycled plastic (Auer et al. 2023). In 2023, researchers studied it in the laboratory, by measuring the quality of recycled pellets at the moment they are mixed and prepared (Auer et al. 2023).
In Norway, where beverage bottles carry a deposit, the return rate for PET bottles rose from 50% in 1999 to 90% by 2009 (Picuno et al. 2025).
Before the bin
Europe has written down an order of preference. In article 4 of directive 2008/98/EC, of 19 November 2008, it places prevention and reuse before recycling (Union europeenne 2008). In 2015, an article examined this five-level hierarchy, in which recycling comes only third, and which quantifies the balance of no particular case (Gharfalkar et al. 2015). The same directive divides the cost of waste management between the original producer and those who hold the waste, without quantifying the expense of each stream (Union europeenne 2008).
Avoiding a piece of waste also means avoiding manufacturing the product that would have become that waste. Three researchers find larger gains when the calculation includes this avoided manufacture, particularly for food waste (Gentil et al. 2011). I have read only the abstract of their study.
In its 2022 impact assessment, the European Commission states that refilling bottles can reduce the impact of beverage packaging. The gain depends on the material, the volume, the journeys and the number of reuses, and no threshold holds for every bottle (European Commission 2022).
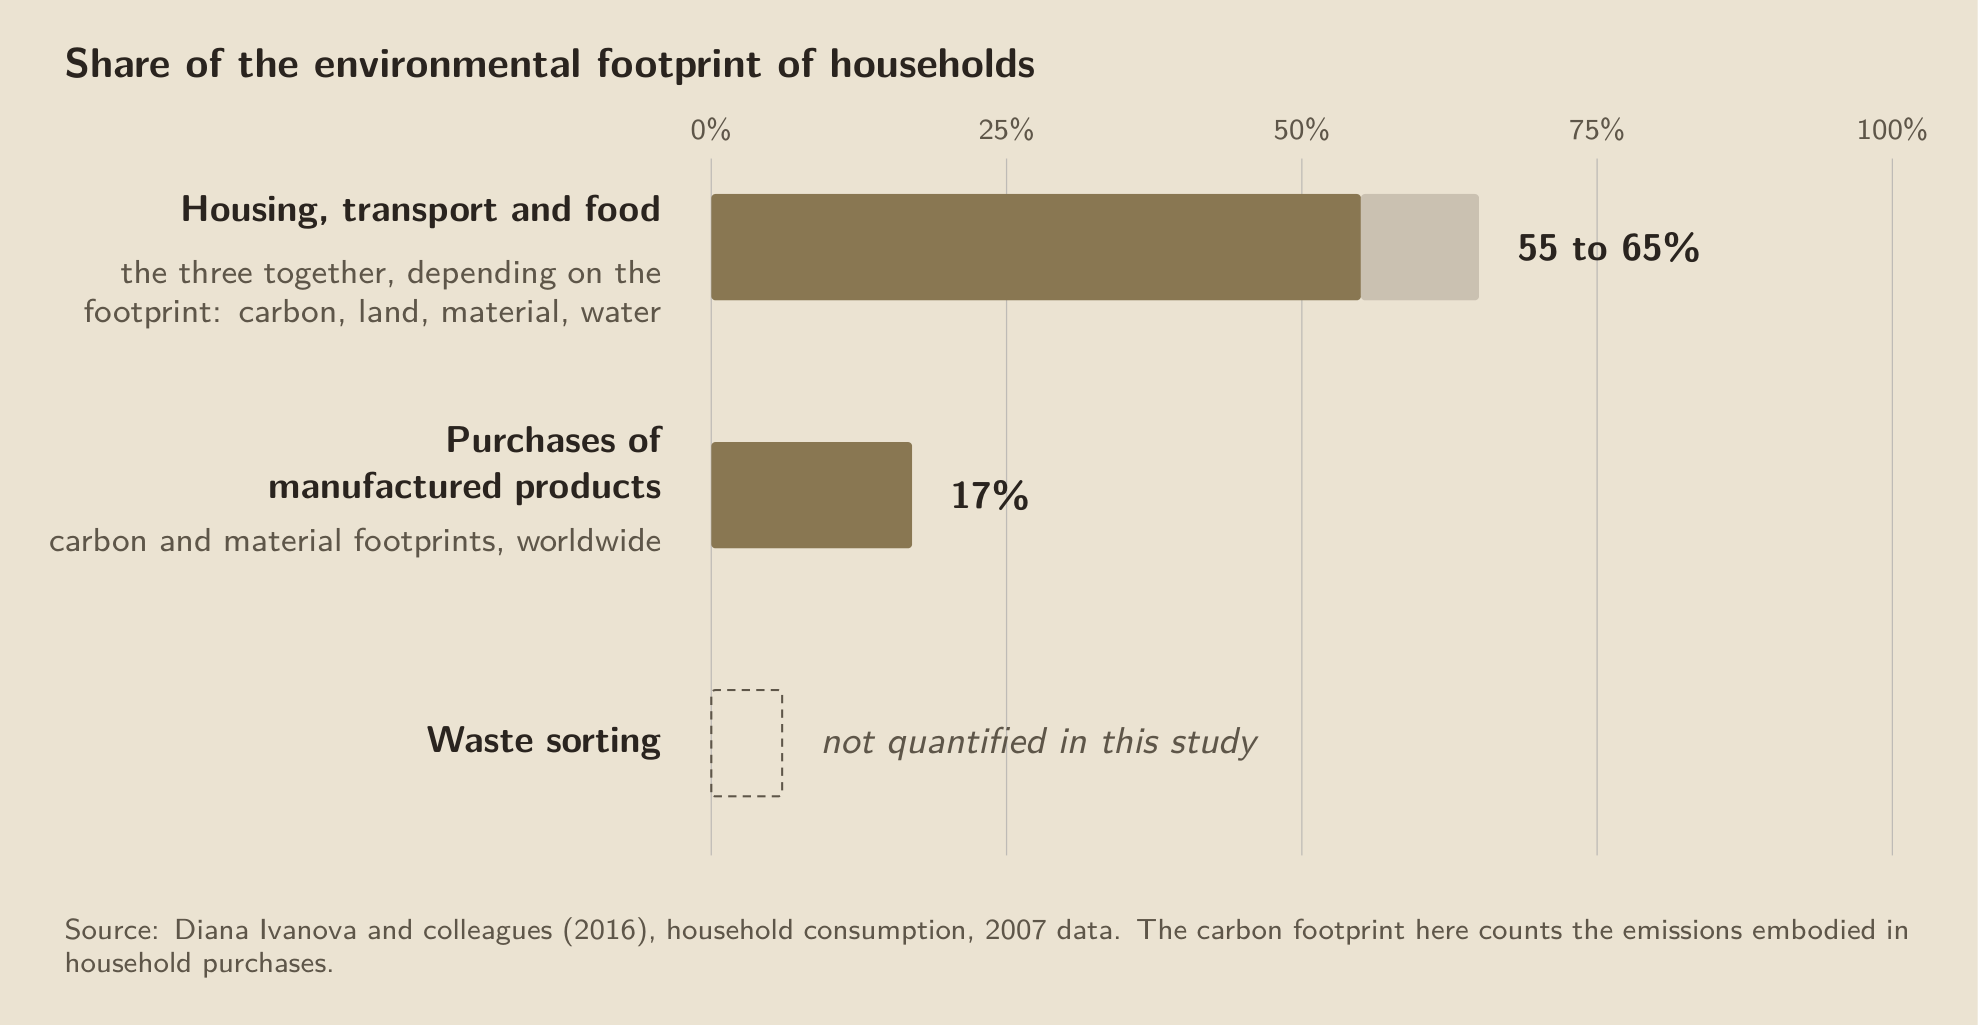
In 2016, a team assessed the weight of each item in the environmental footprint of households. Housing, transport and food weigh the most there, between 55 and 65% of the impacts, and the study does not put a figure on waste sorting (Ivanova et al. 2016).
 Tap to enlarge
I have left aside industrial waste, building-site waste, electronic and organic waste, and the detail of the law that applies to producers. The accounts I read cover six materials from household bins, and above all a single country.
 Tap to enlarge
For my part, I have changed my mind about sorting, at least in part. A remelted can saves almost all the energy of its manufacture (International Aluminium Institute, n.d.), glass and paper go round in a loop with losses, and some of the forgotten metals are caught again in the furnace ashes (Šyc et al. 2020). Mixed plastic is lost along the way, and burning it while recovering its energy is not far from recycling on some indicators (Jeswani et al. 2021). My sorting gestures weigh little beside my food, my heating and my travel (Ivanova et al. 2016). I now set the can aside, and as for the yoghurt pot, I still wonder whether it will end up as pellets or in the furnace.
References
What has changed
- : The text is rewritten as a narrative, starting from the author's doubt, who believed that everything ended up in the furnace. Its title does not change. Switzerland is named, because combustible waste has not gone to landfill there since 1 January 2000. The figure on the levers now shows only the shares quantified by the study it cites, and the table of materials no longer ranks them. What prompted it: The bars of the former figure on the levers came from no source, and the study cited does not quantify waste sorting: the figure now says so. The table of materials gives, for each one, a fact reported by its sources. The article's sources are retained, and each passage points to its own in parentheses. Two sources are added: a 2021 study on the sorting of plastic packaging in Germany, and the encyclopedia article on aluminium electrolysis.10.3390/su13126772
- : The text is rewritten from the author's account of debates between two camps and his views on waste sorting before investigating. The figure on materials specifies the findings on recycling paper and corrugated board. What prompted it: The article now starts from the experience that gave rise to it. The sources are retained; the figure follows the reported tests rather than claiming that fibres degrade with every cycle.
- : The share of plastic deposited for recycling that comes out as reusable pellets is no longer said to be able to fall below half: on the global average, it is about three fifths. What prompted it: The OECD’s Global Plastics Outlook (2022) counts nearly forty per cent losses among what is collected for recycling; no reading quantifies a loss greater than half.10.1787/de747aef-en
- : The account by Geyer, Jambeck and Law (2017) is no longer said to track the gap between collection and recycling: it tracks plastic from production to final fate. What prompted it: The article does not address collection for recycling.10.1126/sciadv.1700782
- : Moral licensing is described as the measures show it, a reputational mechanism that operates in front of witnesses, not a calming of the conscience. What prompted it: A synthesis of 115 experiments finds a clear effect among observed participants and none among the others, a 2019 reanalysis shows that the published size was inflated by publication bias, and the foundational experiment failed to replicate in a preregistered replication. Sorting is done at home, without witnesses.10.1177/0146167225134551210.15626/mp.2018.87810.5334/irsp.945
- : Shifting responsibility from producer to consumer refers to the paper that addresses it. What prompted it: It was declared out of scope without a destination, although another paper in the corpus makes it its subject.
- : The method of the household act is identified as the same as in the paper on the water filter. What prompted it: Two papers in the corpus independently reached the same method for an ordinary action, which is the best internal proof that the corpus has a thesis, and no one had written it.